Understanding the Differences Between Research and Clinical Visual Acuity Charts
Source: EClinCloud. Author: EClinCloud.
In everyday life, visual acuity charts are familiar to everyone. You often hear—


"My vision is 0.8; what is yours?"
During an eye exam at a hospital or a physical checkup, a doctor will also point to an eye chart and ask you—
"Can you see this line? Which one is clearer?"




Quick question: what visual acuity charts are commonly used today?

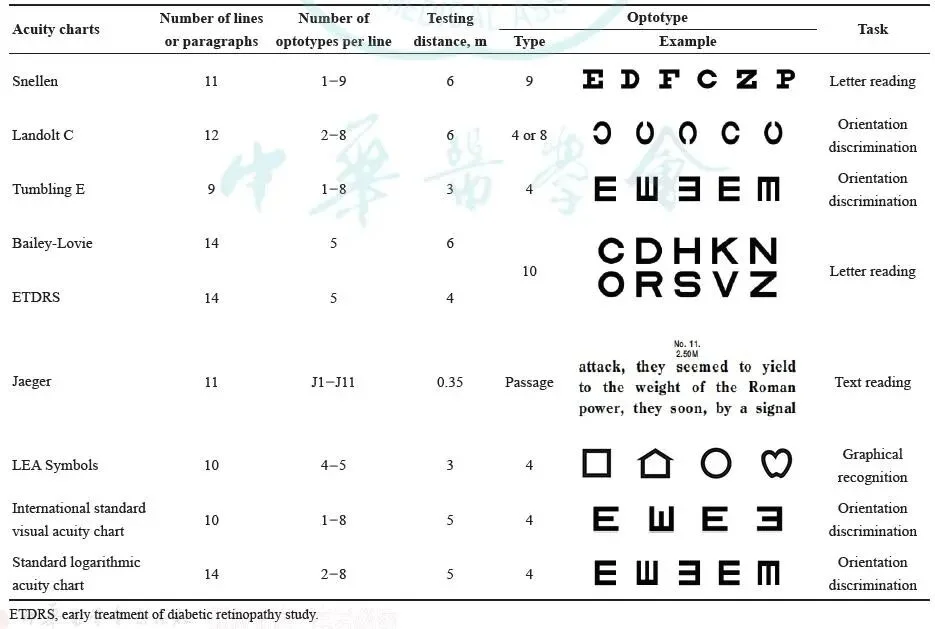
Commonly used visual acuity charts1
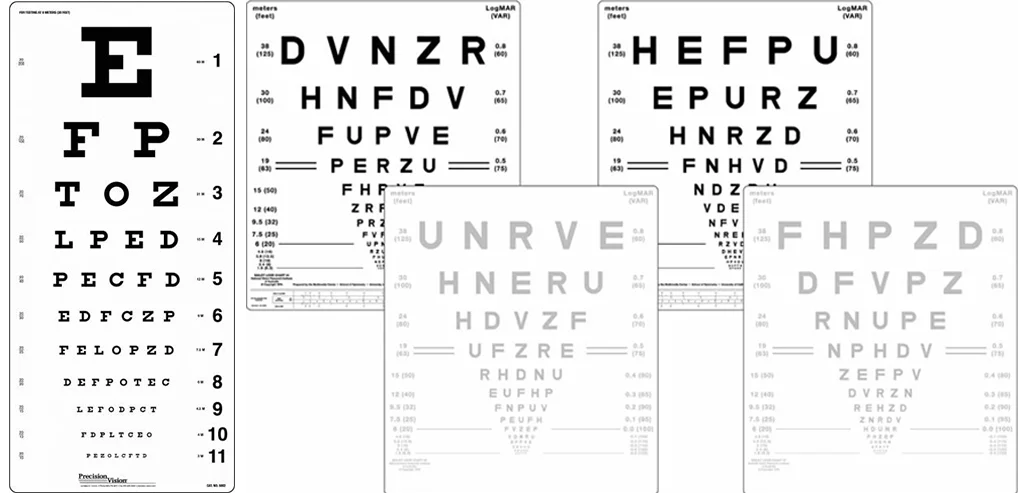
Image source: Precision Vision
So the ETDRS chart is the international gold standard for vision research.

It is primarily used to assess changes in visual acuity following treatment in patients with diabetic retinopathy, and can also be used to assess visual acuity in patients with other ophthalmic diseases such as age-related macular degeneration.
So what distinguishes the ETDRS chart from other visual acuity charts?
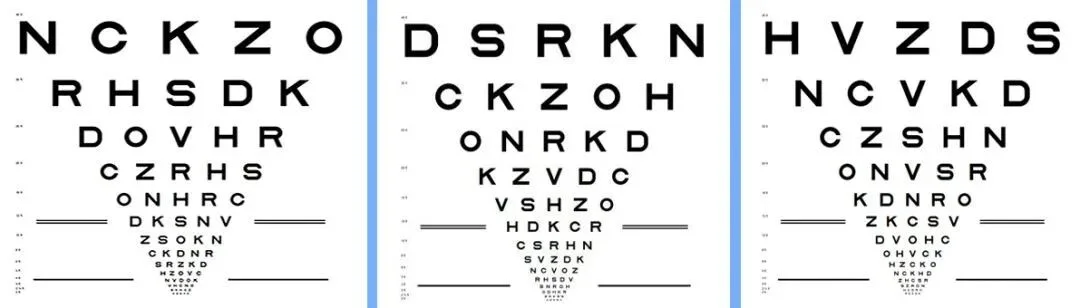
ETDRS Chart 1 ETDRS Chart 2 ETDRS Chart R
Image source: I-SEE.org
What are the advantages of the ETDRS chart?
01
More effective for low-vision testing
This is because the ETDRS chart can be used at variable testing distances.
When letters cannot be read at 4 meters, the testing distance can be moved to 2 meters or even 1 meter;
At 4 meters, an optotype on row n (n ≤ 11) subtends the same visual angle at the human eye as an optotype on row (n + 3) at 2 meters;
At 4 meters, an optotype on row n (n ≤ 8) subtends the same visual angle at the human eye as an optotype on row (n + 6) at 1 meter.

In contrast, the spacing between letters and between rows on the Snellen chart is not standardized. When letters are arranged too closely together, a crowding phenomenon occurs, causing measured visual acuity to be lower than true visual acuity. In addition, the Snellen chart records visual acuity in decimal notation, making the results difficult to convert into logarithmic visual acuity and difficult to use in clinical statistics3. Studies have shown that in the same population, visual acuity test results with the ETDRS chart are better than those with the Snellen chart, especially evident in low-vision testing3.
02
Better repeatability
There is also a substantial difference in repeatability between the ETDRS chart and the Snellen chart, with the former showing better repeatability than the latter. The reported 95% confidence interval (CI) for the coefficient of repeatability (CR) of the ETDRS chart is 0.07–0.16 logMAR (3.5–8 letters) in a normal population, and its CR 95% CI is 0.2–0.3 logMAR (10–15 letters) in a visually impaired population3; whereas the Snellen chart has a large repeated-measurement variability, ranging from 5 to 16.5 letters in a normal population and up to 3.3 lines in patients with ophthalmic disease; such variability is unacceptable for scientific research2.
03
Wider spacing between adjacent letters within a row
The Bailey-Lovie and ETDRS charts share the same design principles, with 5 letters per size level, size increments of exactly 0.10 log units, and standardized spacing between letters and rows. The differences between them are the standard testing distance (6 meters and 4 meters, respectively, with the ETDRS chart also usable at variable distances) and the optotype letter set (1968 British Standard letters vs. Sloan letters, respectively). This choice of letters means that the ETDRS chart has wider spacing between adjacent letters within a row (5 units vs. 4 units)4.

With this brief introduction, you now have an overview of visual acuity charts. As a measurement and assessment tool commonly used in clinical practice, scales are essential for assessing disease severity and supporting objective diagnosis and treatment.
Driven by science and medicine, EClinCloud has built an end-to-end, interconnected, integrated digital clinical trial cloud platform, providing clinical trial endpoint assessment solutions across therapeutic areas (including central nervous system, ophthalmology, and others).
References
1. Cao Suqi, Zhao Yukai, Hou Fang, et al. History, current status, and development trends of visual acuity charts. Chinese Journal of Optometry Ophthalmology and Visual Science, 2021, 23(10):7.
2. Wang Shuang, Liu Yang, Liu Nan, Zhao Jinsong. ETDRS visual acuity chart and its application in age-related macular degeneration. Chinese Journal of Gerontology, 2015,0(17):5008-5010.
3. Tan Qi, Liu Longqian. Principles and use of the ETDRS chart and its comparison with the Snellen chart. Chinese Journal of Optometry Ophthalmology and Visual Science, 2013,15(10):633-636.
4. Bailey IL, Lovie-Kitchin JE. Visual acuity testing. From the laboratory to the clinic. Vision Res. 2013 Sep 20;90:2-9.
EClinCloud is a technology company focused on clinical R&D that provides an integrated, interconnected clinical trial cloud platform (spanning technology products and solutions such as eCOA, CTMS, eTMF, EDC, RTSM, and RM, and offering solutions including scale design, scale copyright management, linguistic validation, rater training, and data quality analysis) as well as clinical trial endpoint assessment technologies across therapeutic areas (including central nervous system, ophthalmology, and others). By combining cutting-edge technology with life-science data, EClinCloud is building a globally leading, patient-centric SaaS cloud platform supporting clinical evidence, helping domestic and international pharmaceutical companies and research institutions improve R&D efficiency, accelerate the market launch of drugs and medical devices, and benefit countless patients.